はじめに
どうも、最近 Rust を勉強し始めた ぐちお@ihcgT_Ykchi です。
Rust を勉強しだしたのは、huggingface の tokenizer のように、python でコードを書く際にピンポイントで高速化できると良さそうと思ったのが一つですが、正直なところ単に春だし新しい言語勉強するか〜って気持ちになったのが大きいです。
ところで、ちょうど最近同期の @cruelturtle が rust を jupyter notebook で使える rustdef というツールを作ったようで、いい機会なので簡単に記事を書いてみようと思いました。
ちなみに私は Rust を勉強し出してまだ 1 week 程なのでかなり筋の悪い書き方をするかもしれないですが、ご容赦下さい。。
#shinjukurs で話しました。Rust を *jupyter notebook* 上で使う https://t.co/f86YXEyVwj
— かめ (@cruelturtle) March 24, 2020
rustdef を使う準備
なんと pip install rustdef だけで ok です。ちなみに、(おそらく) Rust がインストールされている必要があって、また nightly な version が必要です。
その後 Jupyter notebook を起動し、%load_ext rustdef を実行したら準備完了です。あとは下記例の様に %%rustdef と記述したセル内で関数を記述すれば python で呼び出し可能な関数を作ってくれます。(下記例では '4' という出力が得られます。)
# =================================
# cell 1
# =================================

%load_ext rustdef

# =================================
# cell 2
# =================================

%%rustdef

#[pyfunction]
fn sum_str(a: usize, b: usize) -> String {
    (a + b).to_string()
}

# =================================
# cell 3
# =================================

sum_str(1, 3)
ちなみに、dependencies を追加したい場合は %rustdef depends CRATE というセルを実行すればよいです。
各種統計分布を生成してみる
以下、Rust を使って実際に各種統計分布を生成してきます。具体的には 一様分布 ・ 二項分布 ・ 指数分布 ・ 正規分布 を生成していきます。
ちなみに、各種分布の生成にあたっては統計学の赤い本を参照しました。
一様分布
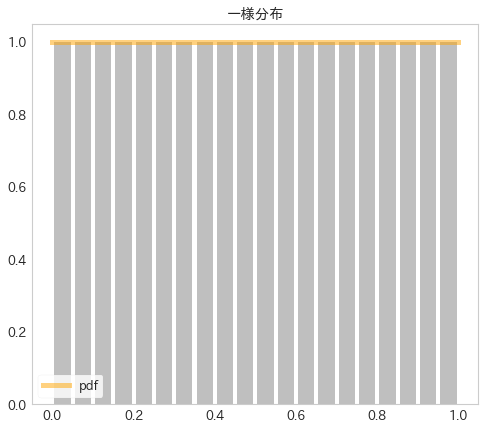
まず線形合同法を使って疑似的な一様乱数を生成し、これにより [0, 1] の一様分布を可視化します。
線形合同法には色々と問題があるので本来はメルセンヌ・ツイスタ使ったりした方が良いのでしょうが、まぁ良い乱数生成はこの記事のスコープ外としてとりあえず知ってるものを使いました。
# =================================
# cell 1
# =================================

%%rustdef

#[pyfunction]
fn gen_unif_rands_lgc(seed: i64, a: i64, c: i64, m: i64, sample_num: i64) -> Vec<f64>{
    let mut res: Vec<f64> = Vec::new();

    let mut x = seed;
    for _i in 0..sample_num {
        x = (a * x + c) % m;
        res.push(x as f64 / m as f64);
    }
    res
}

# =================================
# cell2
# =================================

%%timeit
res = gen_unif_rands_lgc(seed=71, a=111112, c=10, m=999999, sample_num=100_000_000)
timeit の結果は 5.88 s ± 442 ms per loop (mean ± std. dev. of 7 runs, 1 loop each) となり、100,000,000 個の一様乱数生成に約 6s かかっている事がわかります。(多分頑張ればもっと高速化できると思います。)
ちなみに、python で同じ処理を書くと下記の様になり、22.1 s ± 400 ms per loop (mean ± std. dev. of 7 runs, 1 loop each) とやはり rust で書いたほうが高速だったことがわかります。
# =================================
# cell 1
# =================================

def gen_unif_rands_lgc_py(seed, a, c, m, sample_num):
    res = []
    x = seed
    for i in range(sample_num):
        x = (a * x + c) % m
        res.append(x / m)
    return res

# =================================
# cell2
# =================================

%%timeit
res_py = gen_unif_rands_lgc_py(seed=71, a=111112, c=10, m=999999, sample_num=100_000_000)
また、分布は下記のようになり、期待通りの分布が得られていることが分かります。
from scipy.stats import uniform

plt.figure(figsize=(8, 7))

# pdf をプロット
x = np.arange(0, 1, 0.001)
y = uniform.pdf(x)
plt.plot(x, y, label='pdf', color='yellow', linewidth=5.0, alpha=0.5)

# 自作関数のヒストグラムを作成
unif_rands = gen_unif_rands_lgc(seed=71, a=111112, c=10, m=999999, sample_num=10_000_000)
plt.hist(unif_rands, bins=20, color='grey', alpha=0.5, normed=True, rwidth=.8)

plt.title('一様分布')
plt.legend()
plt.grid(None)
plt.show()

二項分布
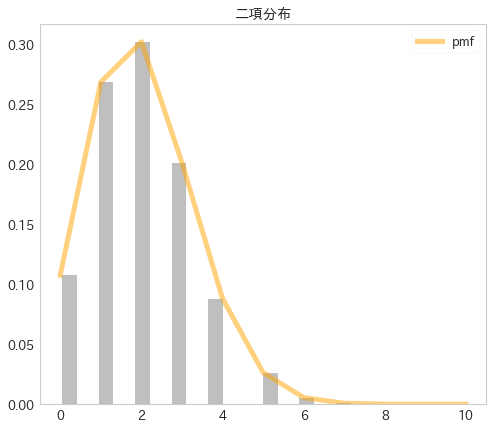
次に、一様乱数を元に二項分布を生成します。0 ~ 1 の一様乱数を n 個生成し、これらの内 p より小さいものの個数を数えることで二項分布に従う確率変数を 1 つ観測する、というシミュレーションを繰り返すことでこれを実現します。
ここで、本当は上で作った gen_unif_rands_lgc 関数を使って一様乱数生成したかったのですが、実装が悪いのか乱数の質が悪いのか意図通りの二項分布が生成できなかったため、Rust の rand crate を使って乱数生成することにしました。
以降の指数分布、正規分布でも同様に rand crate の乱数生成器を使用します。
# =================================
# cell 1
# =================================

%rustdef depends rand

# =================================
# cell 2
# =================================

%%rustdef

use rand;

#[pyfunction]
fn gen_binomial_rands(p: f64, n: i64, sample_num: i64) -> Vec<i64> {
    let mut res: Vec<i64> = Vec::new();

    for _i in 0..sample_num {
        let mut unif_rands: Vec<f64> = Vec::new();
        for _i in 0..n {unif_rands.push(rand::random::<f64>());}
        let sample = unif_rands
            .into_iter()
            .map(|x: f64| -> i64 { (x < p) as i64 })
            .into_iter()
            .sum();
        res.push(sample);
    }
    res
}

# =================================
# cell3
# =================================

from scipy.stats import binom

plt.figure(figsize=(8, 7))

# pmf をプロット
x = range(11)
y = binom.pmf(x, 10, 0.2)
plt.plot(x, y, label='pmf', color='orange', linewidth=5.0, alpha=0.5)

# 自作関数のヒストグラムを作成
binomial_rands = gen_binomial_rands(p=0.2, n=10, sample_num=10_000_000)
weights = np.ones(len(binomial_rands))/float(len(binomial_rands))
plt.hist(binomial_rands, bins=20, color='grey', alpha=0.5, weights=weights, rwidth=.8)

plt.title('二項分布')
plt.legend()
plt.grid(None)
plt.show()

指数分布
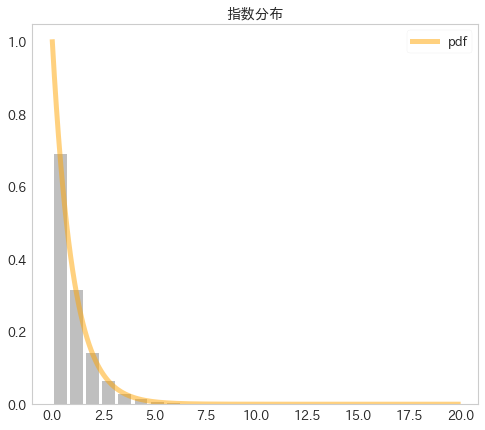
続いて、指数分布を生成します。指数分布は確率が 0 でない定義域が広く一見生成が難しそうにみえますが、逆変換方という手法により生成できます。
逆変換法は、累積分布関数 に従う確率変数
を [0, 1] の一様乱数
から
で求める手法で、指数分布の場合
とかけます。ちなみに、
とした時、
が
を累積分布関数とする確率変数となることの証明は下記のようにかけます。
コードとしては下記のようになり、可視化結果から期待通りの分布が得られていることが分かります。
# =================================
# cell 1
# =================================

%rustdef depends rand

# =================================
# cell 2
# =================================

%%rustdef

use rand;

#[pyfunction]
fn gen_exponential_rands(lambda: f64, sample_num: i64) -> Vec<f64> {
    let mut res: Vec<f64> = Vec::new();

    for _i in 0..sample_num {
        let unif_rand = rand::random::<f64>();
        let sample = -1. / lambda * (1. - unif_rand).ln();
        res.push(sample);
    }

    res
}

# =================================
# cell3
# =================================

from scipy.stats import expon

plt.figure(figsize=(8, 7))

# pdf をプロット
x = np.arange(0, 20, 0.1)
y = expon.pdf(x)
plt.plot(x, y, label='pdf', color='orange', linewidth=5.0, alpha=0.5)

# 自作関数のヒストグラムを作成
exponential_rands = gen_exponential_rands(1, sample_num=10_000_000)
plt.hist(exponential_rands, bins=20, color='grey', alpha=0.5, normed=True, rwidth=.8)

plt.title('指数分布')
plt.legend()
plt.grid(None)
plt.show()

正規分布
最後に、正規分布を生成します。ここでは、二項分布の n に大きい値を取り、中心極限定理により正規分布を作成するという方針を取ります。
ちなみに、rustdef ではセルをまたいだ関数の流用が今現在 (2020/3/29) はできないらしく、ここでは二項分布の生成関数を再度書いています。
# =================================
# cell 1
# =================================

%rustdef depends rand

# =================================
# cell 2
# =================================

%%rustdef

use rand;

#[pyfunction]
fn gen_binomial_rands(p: f64, n: i64, sample_num: i64) -> Vec<i64> {
    let mut res: Vec<i64> = Vec::new();

    for _i in 0..sample_num {
        let mut unif_rands: Vec<f64> = Vec::new();
        for _i in 0..n {unif_rands.push(rand::random::<f64>());}
        let sample = unif_rands
            .into_iter()
            .map(|x: f64| -> i64 { (x < p) as i64 })
            .into_iter()
            .sum();
        res.push(sample);
    }
    res
}

#[pyfunction]
fn gen_normal_rands(mu: f64, sigma: f64, sample_num: i64) -> Vec<f64> {
    let p: f64 = 0.5;
    let n: i64 = 10000;
    let binomial_rands = gen_binomial_rands(p, n, sample_num);
    let bi_mu = (n as f64) * p;
    let bi_sigma = ((n as f64) * p * (1. - p)).powf(0.5);
    let res = binomial_rands
        .into_iter()
        .map(|x: i64| -> f64 {((x as f64) - bi_mu) / bi_sigma})
        .into_iter()
        .map(|x| (x * sigma) + mu)
        .collect::<Vec<f64>>();
    res
}

# =================================
# cell3
# =================================

from scipy.stats import norm

plt.figure(figsize=(8, 7))

# pdf をプロット
x = np.arange(-5, 15, 0.1)
y = norm.pdf(x, 5, 3)
plt.plot(x, y, label='pdf', color='orange', linewidth=5.0, alpha=0.5)

# 自作関数のヒストグラムを作成
normal_rands = gen_normal_rands(5, 3, sample_num=1_000_000)
plt.hist(normal_rands, bins=20, color='grey', alpha=0.5, normed=True, rwidth=.8)

plt.title('正規分布')
plt.legend()
plt.grid(None)
plt.show()

おわりに
rustdef を使うと、python ベースの分析時にピンポイントで Rust を使って高速化するという Rust の使い方が捗りそうで良いなぁと思いました。セル内だと linter がないので (うまくやればできる?)、今回は一度エディタで関数を書いてからセルに移植するという方策をとりましたが、セルに書くくらいの簡単な関数であればそのうち linter なしで書ける様になると思うので問題ないかなぁと思います。
記事を書くのに思ったより時間がかかってしまった...。
